Reading the 1H-NMR Spectra
One of the most practical techniques covered for organic chemistry is the method for determining the chemical structure of unknown compounds. In this article, we will summarize the concept of proton NMR, the most informative NMR spectroscopy utilized by organic chemistry students.
During the second semester of organic chemistry, many professors will ask you to read 1H-NMR spectrum as a question or ask you to use the answer in other parts of the exam, which makes getting the correct structure a major obstacle in getting a great grade on the exam!
Why use proton NMR at all? The answer is abundance. Virtually all organic chemistry molecules contain hydrogen, and since the NMR active isotope is 1H, which has a 99.98% abundance on Earth, it makes it a convenient and easily detected atom. An unknown sample in a strong magnetic field allow 1H nuclei to “resonate”, which means their nuclear spins flip at a unique electromagnetic (EM) frequency (Hertz, Hz). The frequency at which the nuclear spin flips depends on the “chemical environment” the nucleus is in, meaning what other functional groups are in close proximity to the hydrogen atom.
The NMR instrument detects this and plots it on a graph in units of ppm. This value is relative to an internal standard, tetramethylsilane (TMS) which is arbitrarily set at 0 ppm. The signals originating from your unknown sample are recorded as a net difference from the TMS reference. The ranges for common functional groups are shown in the graph below.

Notice that protons (in red) neighboring or attached to electronegative elements (N,O,S,Cl,Br,I) have a large chemical shift (d). This is referred to as “downfield” on the spectrograph. This is due to the deshielding effect, which is simply that the electron cloud around protons near electronegative or electron-withdrawing groups are smaller, so less EM radiation is required to resonate the nucleus. Conversely, when the proton is surrounded by hydrocarbons, the chemical shift is <2 ppm. This is because these proton nuclei are “shielded” from the magnetic field and higher energy is required for them to resonate and referred to as “upfield” on the spectrograph. Once a NMR spectrograph is recorded, 4 pieces of information can be determined from the data as long as the chemical formula of the compound is known.
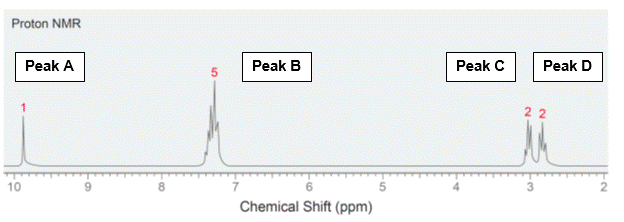
To illustrate the points, we will consider the following 1H-NMR spectrum of the C9H10O.
- Signal Count – Number of unique hydrogens
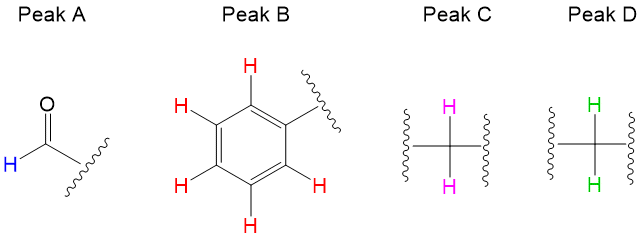
This is the easiest to interpret. The number of peaks correspond to the number of unique, or chemically indistinguishable, hydrogen nuclei. There are 4 peaks on the graph, therefore of the 10 hydrogens in the molecule, there are 4 types of protons.
- Chemical Shift – Identity of neighbors
This information refers to the chart shown above. Peaks C & D on the spectrum are located at (d)3.1 and (d)2.7, likely indicating C-H bonds near some electron-withdrawing groups. Further downfield on the graph, peak B is at 7.4, likely indicating an aromatic group and peak A at 9.9, likely indicating a proton of an aldehyde, which accounts for the one oxygen atom in the formula. From this information, we now know there is an aromatic ring (6 carbons) and an aldehyde (1 carbon). That leaves 2 carbons left, and since two types of C-H bonds from peaks C and D information, therefore we have accounted for all carbons and hydrogens, now we have to put them together.
- Integration – Number of Equivalent Hydrogens
Integration is the calculation of the area beneath the peaks. This information is determined by the computer software and would not be required for you to determine from visual inspection. But if it is provided, it will instantly determine the number of “equivalent” (or chemically indistinguishable) hydrogens in your graph. Looking at our spectra, Peak A = 1 which would make sense for an aldehyde proton. Peak B = 5, meaning an aromatic group with 5 hydrogens, that means only one substituent can be attached to the ring. This is an important piece of information since we could think of many types of rings. Peak C = 2 and Peak D = 2, this is also helpful since we now know both carbons are internal, meaning they are not at the ends of the molecule (we would need 3 hydrogens to be a methyl at the end of the molecule). With this information, you could likely predict the structure.
Signal Splitting – Number of Non-equivalent Hydrogen Neighbors
Signal splitting occurs from a phenomenon of coupling, which occurs when NON-equivalent neighboring protons interfere with the resonance of a proton nuclei.
Rule #1: starting from the hydrogen, count three nuclei away. If you do not land on another proton, then there is no splitting contribution to the proton’s environment.
Rule #2: the degree of splitting occurs in an N+1 rule. For instance, Peak A has a singlet, meaning 0+1. This indicates that there are NO protons neighboring the aldehyde. Peak B is a multiplet, and is indicative of an aromatic group given 5 hydrogens present. Peak C and D are both triplets, meaning 2+1. This means each type of proton has two non-equivalent neighbors. Thus, peak B and C are next to each other.
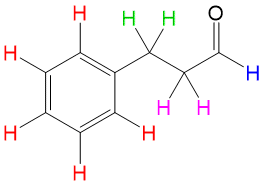
With all of this information, the only chemical structure from the spectrum that would make sense must be 3-phenylpropanal, shown above. This is an example of the clear-cut explanations you will receive with your membership with StudyOrgo. With practice and help from StudyOrgo, you’ll be solving your organic reaction problems in no time!
Want to try it about before you purchase? No problem- check out our sample reaction flashcard page.
Ready to sign up? Sign up here.


